Match each scatterplot to the statement that best describes it.
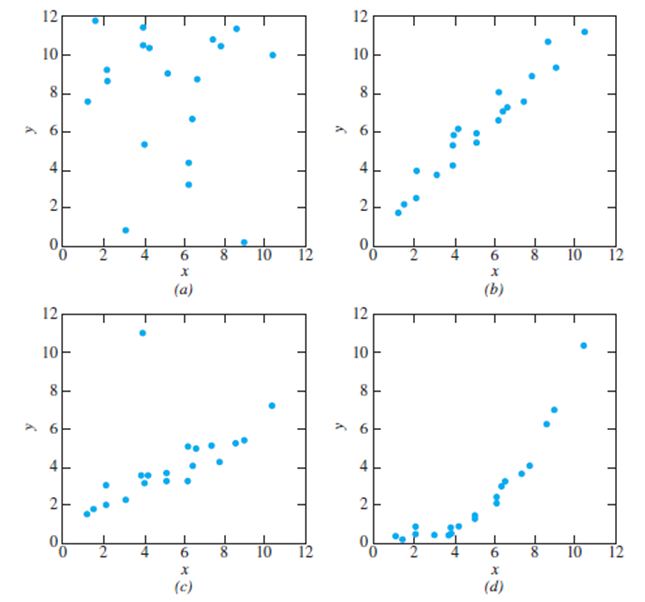
i. The relationship between x and y is approximately linear.
ii. The relationship between x and y is nonlinear.
iii. There isn’t much of any relationship between x and y.
iv. The relationship between x and y is approximately linear, except for an outlier.
(a) iii There isn’t much of any relationship between x and y.
(b) i The relationship between x and y is approximately linear.
(c) iv The relationship between x and y is approximately linear, except for an outlier.
(d) ii The relationship between x and y is nonlinear.
You might also like to view...
An example of an older form of wiring is ____.
a. knob-and-tube b. knob-and-cylinder c. button-and-tube d. button-and-cylinder
What was the forested area in this country 300 years ago? What is it today? Explain how it can be that our smaller
forested area produces more wood today
What will be an ideal response?The pipe size, schedule, and _____ will determine the size of grinding disk you should use.? ?
Fill in the blank(s) with the appropriate word(s).
A diagram used to illustrate the main causes and sub-causes leading to a problem or symptom is a:
A) flow chart. B) root cause. C) Pareto. D) cause-and-effect.