Refer to the graph shown for a small country that is a price taker internationally.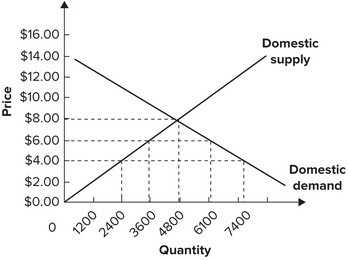 Assume the foreign supply of this product is perfectly elastic at a price of $4 per unit. If government imposes a tariff in the amount of $2 per unit, it will collect revenue in the amount of:
A. $5,000.
B. $2,400.
C. $10,000.
D. $0.
Answer: A
You might also like to view...
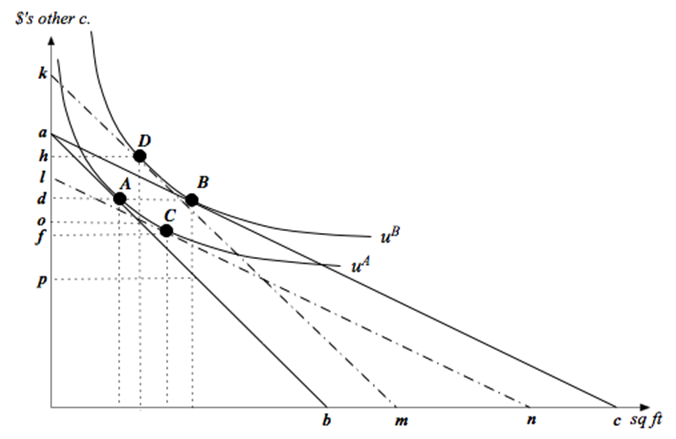
Consider a household with income I and two goods to choose from - square feet of housing (x1) and dollars of other consumption (x2). The annual price per square foot of housing is p, and the household's tastes can be described by the utility function u(x1,x2)= x10.25x20.75. a. How much housing and other goods will the household demand as a function of p and I. b. Suppose income is $100,000 and the price of housing is $10 per square foot. Then the government introduces a subsidy that lowers the housing price to $5 per square foot. In the attached graph, let the solid lines denote the budget lines of the household before and after the subsidy. What are the values of the intercept terms a, b and c in the graph?
c. How much of each good does the household consume at bundle A- i.e. what are the values of d and e in the graph. How much would the household consume of each good after the subsidy?
d. Answer this part in terms of letters on the vertical axis of the graph. What is the most this household would be willing to pay in cash to get this price subsidy? If a household already had the subsidy (without having paid any cash to get it), what is the least that we would have to pay the household in cash for the household to be willing to give up the subsidy?
e. The expenditure function for this household is approximately E(p,u)=1.755p0.25u. Calculate dollar values for the first question in part (d).
f. What is the dollar value for the second question in part (d)?
g. If the subsidy is put in place (without the household making any cash payments to get it), how much will the subsidy cost the government? Express this as a distance in the graph as well as a dollar value.
h. Explain intuitively why there is a deadweight loss of implementing the subsidy - and then calculate the dollar value of the deadweight loss.
i. Calculate the bundles C and D in the graph - i.e. calculate the values for f, g, h and i. (Hint: You can do this a number of different ways - but the quickest way would be to use your answers to parts (e) and (f).)
What will be an ideal response?
The shape of the production possibilities curve in the above figure indicates that
A) production of corn is characterized by increasing costs while the production of cloth is characterized by decreasing costs. B) production of both corn and cloth is characterized by increasing costs. C) production of both corn and cloth is characterized by constant costs. D) production of corn is characterized by constant costs and the production of cloth is characterized by increasing costs.
If excess reserves are $10 million, (total) reserves are $14 million, and the required reserve ratio is 10%, then required reserves equal ________________ and checkable deposits equal ____________________
A) $4 million; $40 million B) $40 million; $4 million C) $24 million; $240 million D) $7 million; $70 million
In public education, the value of the services provided is
A. greater than the value that parents and students place on the services. B. zero since they are a public good. C. less than the value that parents and students place on the services. D. equal to the value that parents and students place on the services.