Consider a household with income I and two goods to choose from - square feet of housing (x1) and dollars of other consumption (x2). The annual price per square foot of housing is p, and the household's tastes can be described by the utility function u(x1,x2)= x10.25x20.75.
a. How much housing and other goods will the household demand as a function of p and I.
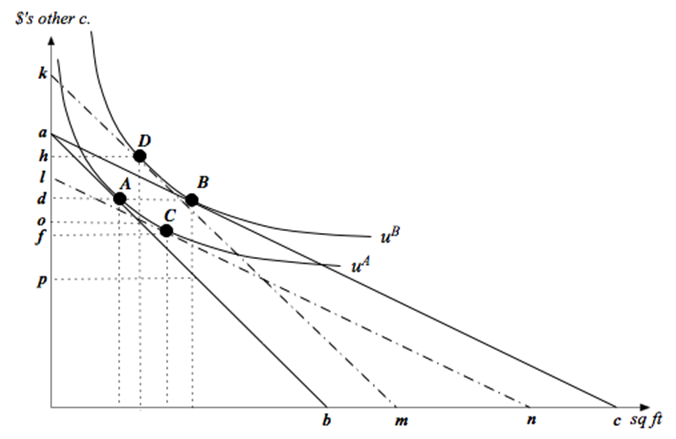
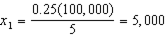
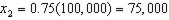
b. Suppose income is $100,000 and the price of housing is $10 per square foot. Then the government introduces a subsidy that lowers the housing price to $5 per square foot. In the attached graph, let the solid lines denote the budget lines of the household before and after the subsidy. What are the values of the intercept terms a, b and c in the graph?
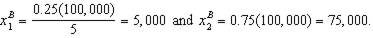
c. How much of each good does the household consume at bundle A- i.e. what are the values of d and e in the graph. How much would the household consume of each good after the subsidy?
d. Answer this part in terms of letters on the vertical axis of the graph. What is the most this household would be willing to pay in cash to get this price subsidy? If a household already had the subsidy (without having paid any cash to get it), what is the least that we would have to pay the household in cash for the household to be willing to give up the subsidy?
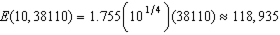
e. The expenditure function for this household is approximately E(p,u)=1.755p0.25u. Calculate dollar values for the first question in part (d).
f. What is the dollar value for the second question in part (d)?
g. If the subsidy is put in place (without the household making any cash payments to get it), how much will the subsidy cost the government? Express this as a distance in the graph as well as a dollar value.
h. Explain intuitively why there is a deadweight loss of implementing the subsidy - and then calculate the dollar value of the deadweight loss.
i. Calculate the bundles C and D in the graph - i.e. calculate the values for f, g, h and i. (Hint: You can do this a number of different ways - but the quickest way would be to use your answers to parts (e) and (f).)
What will be an ideal response?
b. a=100,000; b=10,000; c=20,000
c.
 ;
; 
After the subsidy:
d. The most a household is willing to pay for the subsidy is
 .
.The least we would have to pay the household to give up the subsidy is
 .
.e. To calculate
 : First, we need to know
  which is
We then use the expenditure function to determine the income necessary to get to bundle C at  ; i.e.
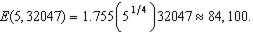
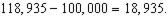
The household would therefore be willing to pay as much as

to get the subsidy.
f. To calculate  : Now we need to know
  -- so we need to know B which is
Thus, 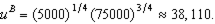 Using the expenditure function, we then get
which implies that the least we would have to pay someone to eliminate the subsidy is
g. The distance in the graph is  . Since the consumer buys 5,000 square feet after the subsidy, and since the government pays $5 per square foot, the dollar amount is 5(5000)=25,000.
h. The deadweight loss arises from the fact that the consumer buys more housing in part because the government has distorted the price. The subsidy makes the consumer better off because it allows the consumer to reach  -- but the cheapest way to get the consumer to
  is by simply paying her
  , or $18,935 (as we calculated in (f)). By getting the consumer to
  through the subsidy, it costs us $25,000. We are therefore spending 25,000-18,935=$6,065 more than we need to -- which is the deadweight loss.
i. For C: In (e), we calculated that the income necessary to get to C (at the subsidized price of 5) is $84,100. Using our demand function from (a), we then get
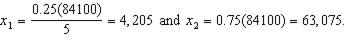
For D: From (f) we know  at
at  to get to D -- so
You might also like to view...
Suppose that the local hospital claims that the wages of nurses are too high. Yet, the hospital has 10 nursing positions open and no applicants for the jobs. Is the hospital's claim legitimate? Why or why not?
What will be an ideal response?
Unlike Social Security's pension program, Medicare's funding is anchored in a trust fund
Indicate whether the statement is true or false
This graph demonstrates the domestic demand and supply for a good, as well as the world price for that good.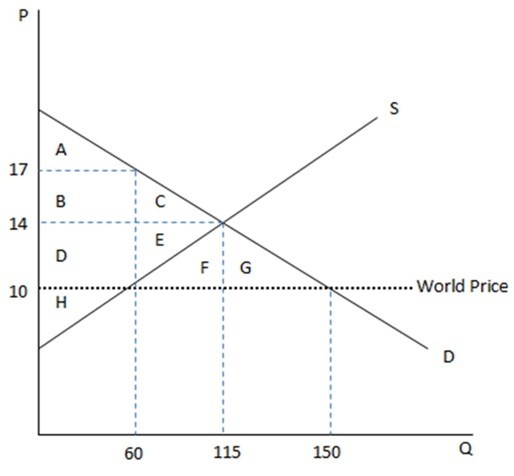 According to the graph shown, if this economy were to open to trade, the amount consumed domestically would:
A. increase by 35. B. decrease by 90. C. decrease by 35. D. increase by 90.
Which best describes the "invisible hand" concept?
a. Sufficiently detailed central direction of an economy will maximize the public's best interests b. The desires of producers and resource suppliers to further their own self-interest will automatically promote the social interest c. The market system works best when resources are highly substitutable d. The problem of scarcity can best be overcome in a system