Figure 10-6
?

In Figure 10-6, which graph best illustrates an adverse supply shock accompanied by an increase in government spending?
A. -1
B. -2
C. -3
D. -4
Answer: D
You might also like to view...
Use the following diagram for the market for money to answer the next question.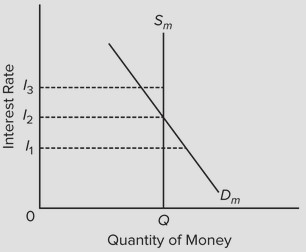 The vertical money supply curve Sm reflects the fact that
A. bond prices and interest rates are inversely related. B. the rate at which money is spent is zero. C. the stock of money is determined by the Federal Reserve System and does not change when the interest rate changes. D. lower interest rates result in lower opportunity costs of supplying money.
If the ________ effect is greater than the ___________ effect, a tax cut will increase revenues.
A. price; quantity B. quantity; income C. income; price D. quantity; price
For people with very low incomes, the Earned Income Tax Credit operates like a(n):
A. lump sum transfer. B. wage subsidy. C. in-kind transfer. D. tax on wages.
If Saudi Arabia has invested substantially more money in foreign countries than foreigners have invested in Saudi Arabia, then we might expect Saudi:
A. GNP to exceed Saudi GDP. B. net foreign factor income to be negative. C. GDP to exceed Saudi GNP. D. net foreign factor income to be zero.