A decrease in demand is shown graphically by a:
a. Downward movement along the demand curve
b. Decrease in the cost of production
c. Movement up along the demand curve
d. Shift of the demand curve to the left
Answer: d. Shift of the demand curve to the left
You might also like to view...
An increase in market demand will cause an increase in industry output in the long run because
a. new firms enter the industry. b. new firms enter the industry and all firms increase their output. c. all firms decrease their output but more new firms enter. d. no firms enter but the existing firms increase their output.
A manager of a firm with market power faces the marginal revenue product and average revenue product curves shown below. The firm incurs weekly fixed costs of $1,800. The firm employs a single variable input, labor, which costs $600 per worker each week.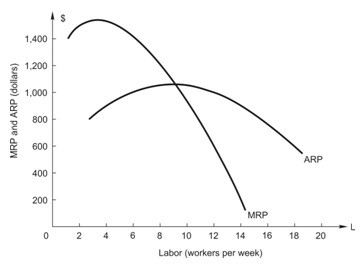 Given the above, in order to maximize profit, the manager should hire ________ workers per week.
A. 10 B. 12 C. 9 D. 18
Indirect incentive
What will be an ideal response?
A good with an income elasticity of 0.4 is:
A. a normal good. B. a substitute good. C. a luxury good. D. an inferior good.