In the figure above, the lowest 20 percent of all households own ________ percent of all wealth, the next lowest 20 percent own ________ percent of all wealth and the richest 20 percent own ________ percent of all wealth
A) 20; 20; 20
B) 20; 40; 100
C) 5; 15; 40
D) 5; 20; 60
C
You might also like to view...
The federal government budget has generally been in a deficit for the past several decades because
A) budget deficits promote full employment. B) every year during those decades was a recession year in which expansionary fiscal policy was called for. C) military expenditures were increased steadily throughout those decades. D) political pressure on Congress to increase taxes and to balance the budget were less effective than political pressure to increase expenditures.
This graph represents the cost and revenue curves of a firm in a perfectly competitive market.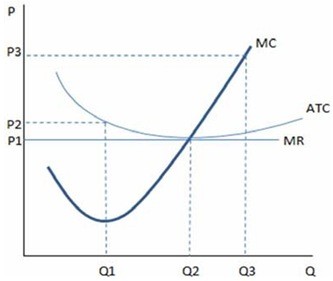 According to the graph shown, if a firm is producing at Q2:
A. it is producing at an efficient scale. B. average total costs are minimized. C. profits are being maximized. D. All of these are true.
If you want to earn a high income you should figure out what others value because
What will be an ideal response?
A period during which aggregate output rises is known as a(n)
A. recession. B. hyperinflation. C. inflation. D. expansion.