This graph represents the cost and revenue curves of a firm in a perfectly competitive market.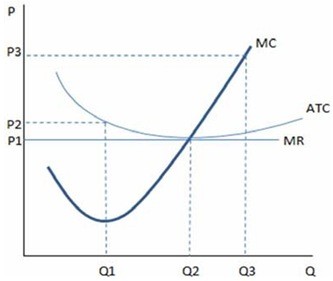 According to the graph shown, if a firm is producing at Q2:
A. it is producing at an efficient scale.
B. average total costs are minimized.
C. profits are being maximized.
D. All of these are true.
Answer: D
You might also like to view...
Which auction format generates the most revenue for the seller?
a. First price. b. Second price. c. They generate the same expected revenue. d. Depends on the environment.
According to the graph shown, if the economy is operating under free trade, who would be in favor of a tariff?
This graph demonstrates the domestic demand and supply for a good, as well as a tariff and the world price for that good.
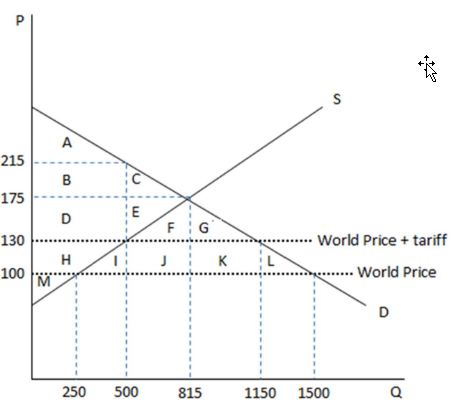
A. Domestic producers
B. Domestic consumers
C. Foreign producers
D. Foreign governments.
Exchange rates determined by the forces of demand and supply are called
a. fixed exchange rates. b. floating exchange rates. c. equilibrium exchange rates. d. dirty exchange rates.
Figure 10-16
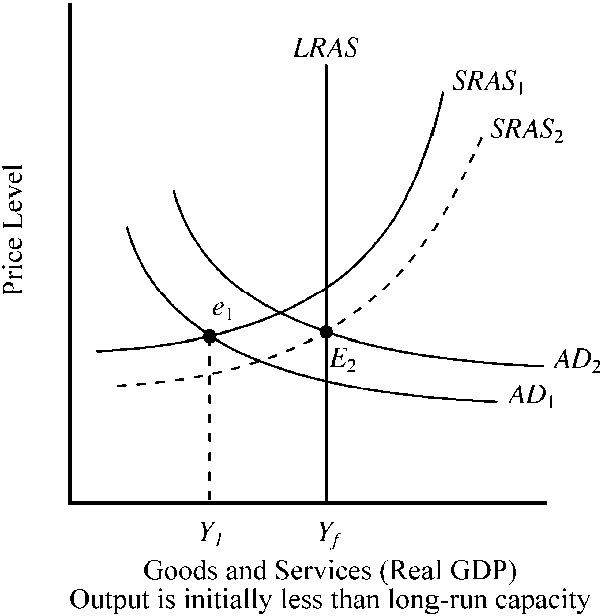
With the passage of time, which of the following will help direct this economy in toward its potential long-run rate of output?
a.
lower interest rates that will stimulate AD and lower resource prices that will increase SRAS
b.
higher interest rates that will reduce aggregate demand and higher resource prices that will reduce SRAS
c.
lower interest rates and higher resource prices, both of which will stimulate aggregate demand
d.
higher interest rates that will reduce SRAS and lower resource prices that will stimulate aggregate demand