The yield on a 30-year U.S. Treasury security is 6.5%; the yield on a 2-year U.S. Treasury bond is 4.0%. This data indicate:
A. the yield curve is upward sloping.
B. that people expect inflation to decrease in the future.
C. the yield curve is flat since the risk premium needs to be added for longer maturities.
D. the yield curve is downward sloping.
Answer: A
You might also like to view...
The supply curve of loanable funds slopes up because
A) at higher bond prices more loanable funds will be supplied. B) higher interest rates reduce the inflation rate. C) an increase in the interest rate makes lenders more willing and able to supply more funds. D) a decrease in the interest rate makes lenders more willing and able to supply more funds.
The expected value is
A) the total of all possible outcomes. B) the arithmetic average of all possible outcomes. C) the average of all possible outcomes weighted by their respective probabilities. D) the total of all possible outcomes divided by the number of different possible outcomes.
Assuming the economy is represented by the graph shown, if the government were to enact a partially successful expansionary fiscal policy, it would be most likely to:
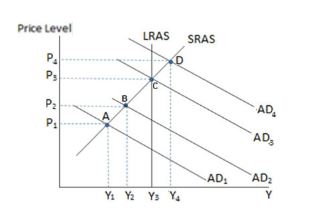
A. move from equilibrium A to B.
B. move from equilibrium B to A.
C. cause unemployment to temporarily increase.
D. cause deflation.
Explain how a "leaky bucket" can be used to illustrate the utilitarian argument that governments should not attempt to completely equalize individual incomes