Suppose the figure below illustrates the demand curve facing a monopolist. 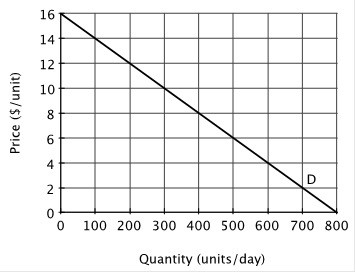 If the monopolist decreases its price from $12 to $10, its total revenue will ________.
A. decrease by $600
B. decrease by $1000
C. increase by $600
D. increase by $1000
Answer: C
You might also like to view...
Why does investment spending rise and fall with the overall level of GDP in the economy?
What will be an ideal response?
What are the four explanations given as to why the Fed did not intervene to stabilize the banking system during the Great Depression?
What will be an ideal response?
Which of the following is true? a. Virtually all theories in economics are expressed using a ceteris paribus ("let everything else be equal" or "holding everything else constant") assumption. b. The fallacy of composition is that, even if something is true for an individual, it is not necessarily true for many individuals as a group. c. One must always be careful not to confuse correlation
with causation. d. All of the above are true.
When comparing the slopes of the aggregate-demand and aggregate-supply curves to the slopes of demand and supply curves for specific goods and services, the explanations are
a) the same for all the curves. b) quite different for the aggregate curves from the specific market curves. c) the same for the demand curves but not the supply curves. d) the same for the supply curves but not the demand curves.