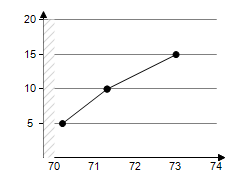
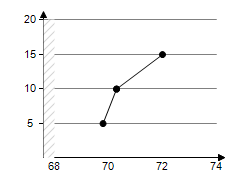
The numbers N (in millions) of students enrolled in schools in the United States from 1995 through 1997 are shown in the table.
?
Year Number, N 1995 71.2 1996 72.3 1997 74?
?
Use a graphing utility to create a scatter plot of the data. Let t represent the year, with t = 5 corresponding to 1995.
?
A. ?
?
B. ?
C. ?
D. ?
E. ?
Answer: A
Mathematics
You might also like to view...
Find the second derivative.w = z-5 - 
A. -5z-7 - 
B. 30z-7 - 
C. 30z-7 + 
D. -5z-6 + 
Mathematics
Approximate the value using a calculator. Express answer rounded to three decimal places.2.4342.259
A. 8.716 B. 5.498 C. 7.459 D. 7.268
Mathematics
Solve for the indicated variable.T = T0ekt/300, for t
A. t =  ln
ln 
B. t =  ln (T - T0)
C. t =  ln
ln 
D. t = 
Mathematics
Use the graph of the function f to draw the graph of the inverse function f-1. 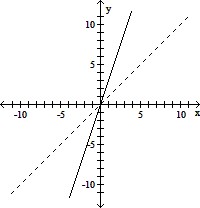
A. 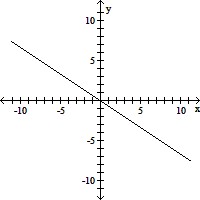
B. 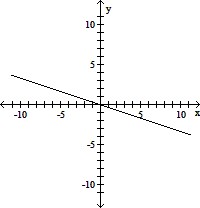
C. 
D. 
Mathematics