Determine the values of x for which the function, as represented by the graph, is continuous. If the function is not continuous, determine the reason.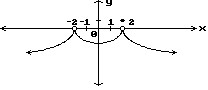
A. Not continuous at x = -2; function not defined
Not continuous at x = 2; small change
B. Not continuous at x = -2, x = 2; function not defined
C. Not continuous at x = -2, x = 0; function not defined
Not continuous at x = 2; small change
D. Not continuous at x = -2; function not defined
Answer: A
You might also like to view...
Solve the problem. Where appropriate, round to the nearest tenth of a percent.By switching service providers, a family's telephone bill decreased from about  a month to about
  What was the percent decrease?
A. 11.1% B. 5% C. 10% D. 11%
First, rewrite each equation in exponential form. Then, use a table of coordinates and the exponential form to graph the logarithmic function. Begin by selecting -2, -1, 0, 1 and 2 for y. Finally, based on your graph, describe the shape of a scatter plot that can be modeled by f(x) = log b x, 0 < b < 1.y = log1/7 x
A. 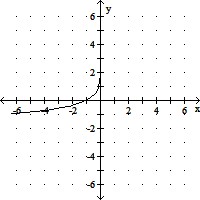
increasing
B. 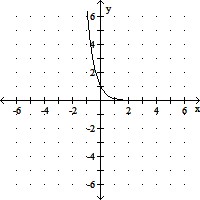
decreasing,
although rate of decrease is slowing down
C. 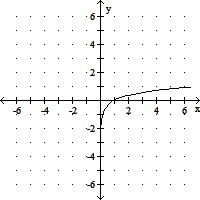
increasing,
although rate of increase is slowing down
D. 
decreasing,
although rate of decrease is slowing down
List the simple statements contained in the quotation and assign each one a letter. Then rewrite the compound statement in symbolic form."If he does that, I will scream, but if he doesn't, I won't."
What will be an ideal response?
Solve. = 6h
= 6h
A. h = 
B. h = 14
C. h = 10
D. h = 2