In the diagram, curves 1, 2, and 3 represent the:
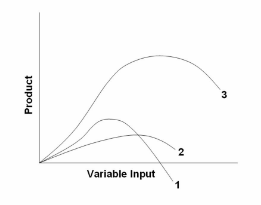
A. average, marginal, and total product curves respectively.
B. marginal, average, and total product curves respectively.
C. total, average, and marginal product curves respectively.
D. total, marginal, and average product curves respectively.
B. marginal, average, and total product curves respectively.
You might also like to view...
XDF Corporation had a P/E ratio of 25, earnings per share of $4, and retained earnings per share of $3 . What was its dividend yield?
a. 4% b. 3% c. 1% d. None of the above is correct.
Which of the following always results in an increase in equilibrium price and quantity?
A) an increase in supply and a decrease in demand B) an increase in demand with no change in supply C) an increase in supply with no change in demand D) all of the above
Starting from long-run equilibrium, a war that raises government purchases results in ________ output in the short run and ________ output in the long run.
A. lower; potential B. higher; potential C. higher; higher D. lower; higher
Figure 7.3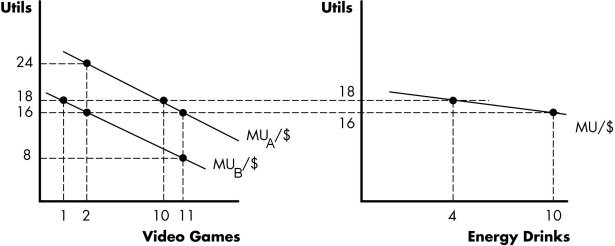 The price of Video Game rentals is $2 For MUA/$ and $4 for MUB/$.The price of Energy Drinks is $2.Budget = $28.Refer to Figure 7.3. If the price of video game rentals drops from $4 to $2, the marginal utility per dollar at the utility maximizing combination is ________ utils for video game rentals and ________ utils for energy drinks.
A. 18; 18 B. 18; 16 C. 16; 16 D. 8; 16