The following comparison line graph indicates the number of vehicles sold for a seven week period by two different salespeople. Use the graph to answer the question. During what week did Pat sell the fewest number of vehicles?
A. Week 1
B. Week 7
C. Week 3
D. Week 5
Answer: C
Mathematics
You might also like to view...
Solve the problem.Open parallel transmission lines have a characteristic impedance given by  Write the expression on the right side as the logarithm of a single quantity.
A. log 10 (a/b) B. 252 log 10 (a/b) C. log 10 (a - b)252 D. log 10 (a/b)252
Mathematics
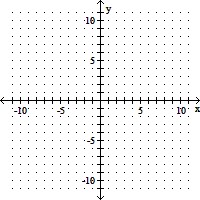
Use the graph of f to sketch a graph of the inverse of f using a dashed curve.
A. 
B. 
C. 
D. 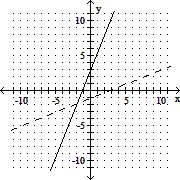
Mathematics
Graph the given function as a solid line (or curve) and its inverse as a dashed line (or curve) on the same set of axes.f(x) = - 
A. 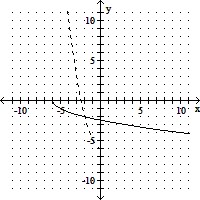
B. 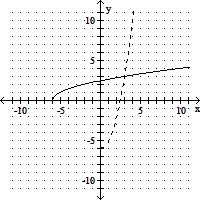
C. 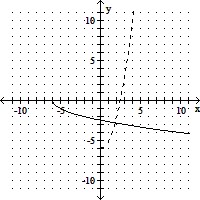
D. 
Mathematics
Find the slope and the y-intercept.x + y = 12
A. m = -1; (0, -12) B. m = 0; (0, 12) C. m = -1; (0, 12) D. m = 1; (0, 12)
Mathematics