For a particular commodity, the quantity produced and the unit price are given by the coordinates of the point where the supply and demand curves intersect. Determine the point of intersection for the following supply and demand curves. Demand curve: p = 9 - 10x, Supply curve: p = 1 + 10x
A. 
B. 
C. 
D. 
Answer: C
Mathematics
You might also like to view...
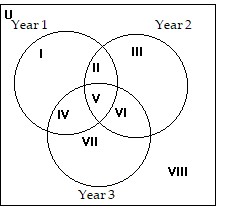
Determine which region, I through VII, the indicated element belongs.The chart that follows shows people's loyalty to specific grocery stores. In the Venn diagram given, the set indicated as Year 1 represents the set of grocery stores listed in the table under Year 1, and so on.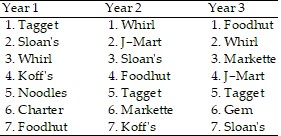
 Markette
A. VI B. I C. II D. VII
Mathematics
The bar graph shows the number of new residents in several towns during the years 1999 to 2001. Use the graph to answer the question. 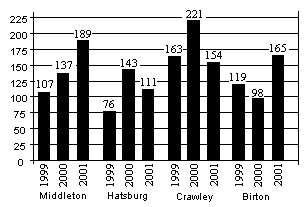 Of the total number of new residents in Hatsburg during the period 1999-2001, what fraction arrived in the year 2000?
A. 
B. 
C. 
D. 
Mathematics
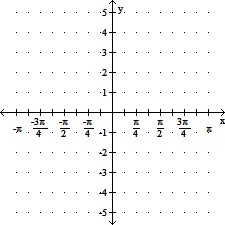
Graph the function.y = 5 cot
A. 
B. 
C. 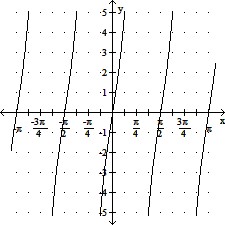
D. 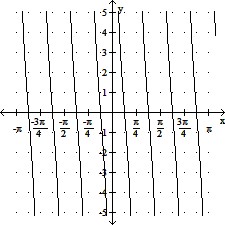
Mathematics
Use the slope and y-intercept to graph the linear function.9x - 5y = 0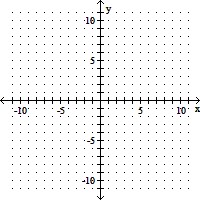
A. 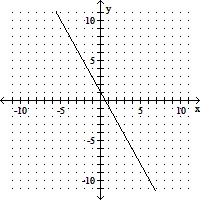
B. 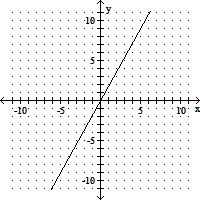
C. 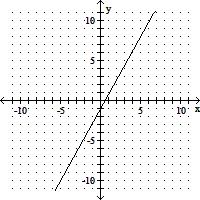
D. 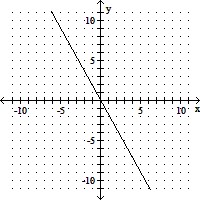
Mathematics