Solve the problem.The function f models the population of Country X from 1991 to 1998. The graphs of f and the horizontal line y = 345 are shown in the figure. Use the graphs to determine when there was (i) a population equal to 345 million and (ii) a population of 345 million or less. 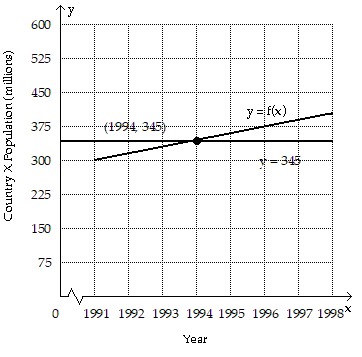
A. between 1994 and 1998; earlier than 1994
B. 1994; between 1991 and 1994
C. 1994; after 1994
D. 1995; between 1991 and 1995
Answer: B
You might also like to view...
Use the order of operations to simplify the expression. 3?
3? 3
3
A. 
B. 
C. 
D. 
The pair of figures is similar. Find the missing side n. Round to the nearest tenth when necessary.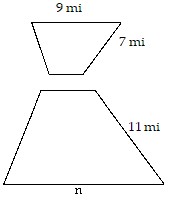
A. n = 5.7 mi B. n = 693 mi C. n = 14.1 mi D. n = 8.6 mi
Decide whether the following is a statement or is not a statement.Mary has a cat.
A. Statement B. Not a statement
Solve the problem.The pH of a solution ranges from 0 to 14. An acid has a pH less than 7. Pure water is neutral and has a pH of 7. The pH of a solution is given by  where x represents the concentration of the hydrogen ions in the solution in moles per liter. Find the pH if the hydrogen ion concentration is
A. 4.33 B. 4.67 C. 3.33 D. 3.67