This double-bar graph shows the number of male (M) and female (F) athletes at a university over a four-year period. Answer the question.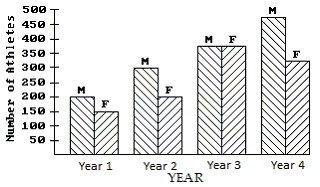 Which year had the greatest number of female athletes?
A. Year 3
B. Year 4
C. Year 2
D. Year 1
Answer: A
You might also like to view...
Perform the indicated operation. Express the answer in scientific notation.(5.3 × 10⁷)(8 × 10⁻⁸)
A. 4.24 × 100 B. 4.24 × 10⁻² C. 42.4 × 10⁻¹ D. 4.24 × 10⁻¹
Solve the problem.Two cars leave a city and head in the same direction. After 5 hours, the faster car is 40 miles ahead of the slower car. The slower car has traveled 240 miles. Find the speeds of the two cars.
A. 40 mph and 48 mph B. 50 mph and 58 mph C. 48 mph and 56 mph D. 80 mph and 88 mph
Graph the pair of parametric equations by hand, using values of t in [-2,2]. Make a table of t-, x-, and y-values, using t = -2, -1, 0, 1, and 2. Then plot the points and join them with a line or smooth curve for all values of t in [-2,2]. Do not use a calculator.x = -t2 - 1, y = t + 2

What will be an ideal response?
Factor.13m2 - 15r3
A. No common factor B. 2(6m2 + 7r3) C. 3(4m2 - 5r3) D. m2(13 - 15m)