Evaluate.3 - 82
A. 61
B. -25
C. -61
D. 25
Answer: C
You might also like to view...
Solve the problem.The following bar graph shows the average annual income for single mothers. i) Determine a linear function that can be used to estimate the average yearly income for single mothers from year 0 through year 5. Let t represent the year.ii) Using the function from part i, determine the average yearly income for single mothers in year 3.iii) Assuming this trend continues, determine the average yearly income for single mothers in year 13.iv) Assuming this trend continues, in which year will the average yearly income for single mothers reach $33,000?
A.
| i) | I(t) = 775.8t + 24,269 |
iii) $34,354.40
iv) year 12
B.
| i) | I(t) = 775.8t + 24,269 |
iii) $34,354.40
iv) year 12
C.
| i) | I(t) = 770.8t + 24,269 |
iii) $34,289.40
iv) year 12
D.
| i) | I(t) = 775.8t + 24,269 |
iii) $34,354.40
iv) year 13
Divide and simplify.-5x ÷ 
A. - 
B. - 
C. - 
D. - 
Solve the problem.If a parking ramp attendant can wait on 6 vehicles per minute, and vehicles are leaving the ramp at x vehicles per minute, then the average wait in minutes for a car trying to exit is given by  Solve the inequality
  to determine the exit rates x that would result in average wait times between 2 and 10 minutes.
A. x ? 5.9 or x ? 5.5 B. 0.7 ? x ? 3.5 C. 5.5 ? x ? 5.9 D. 5.4 ? x ? 6.0
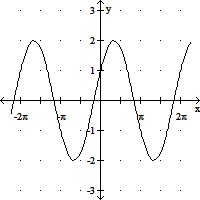
Graph the function.f(t) = cos 
A. 
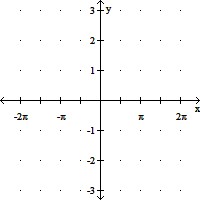
B. 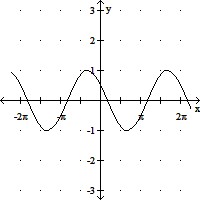
C. 
D.