The above figures show the market for oranges. Which figure shows the effect of changing consumer preferences for more orange juice and less coffee in the morning?
A) Figure A
B) Figure B
C) Figure C
D) Figure D
A
You might also like to view...
Refer to Figure 2-16. One segment of the circular flow diagram in the figure shows the flow of goods and services from market C to economic agents A. What is market C and who are economic agents A?
A) C = factor markets; A = households B) C= product markets; A = firms C) C = factor markets; A = firms D) C = product markets; A = households
Assume that the M1 multiplier is 4. If the Federal Reserve purchases $200 worth of government securities, the money supply will
A) rise by $200. B) rise by $800. C) fall by $200. D) fall by $800.
The tax with the minimum excess burden of taxation is most desirable from an efficiency standpoint because _____
a. it suggest that people substituted away from the tax by a considerable amount b. it minimizes tax shifting c. it produces the least social cost per dollar of revenue raised d. it will raise the most revenue for government
The graph shown demonstrates a tax on sellers. Once the tax has been imposed, the sellers produce ____ units and receive _____ for each one sold.
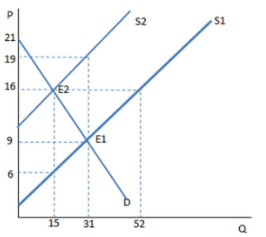
A. 15; $16
B. 15; $6
C. 31; $9
D. 31; $19