Match the function  with one of the following graphs.
?
A. ?
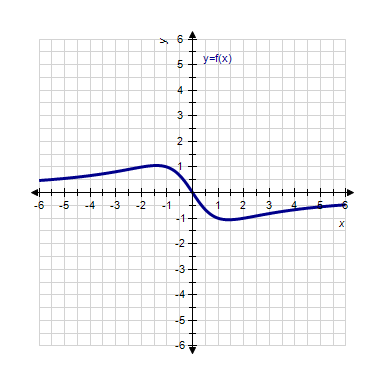
B. ?
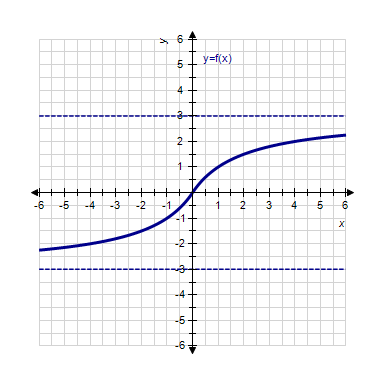
C. ?
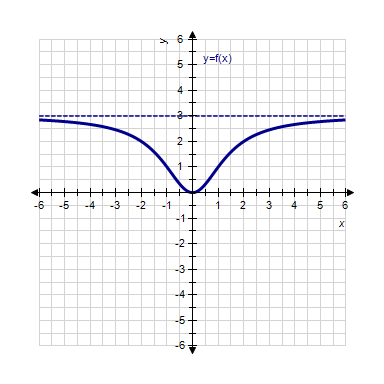
D. ?
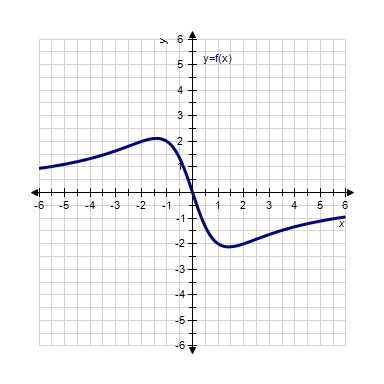
E. ?
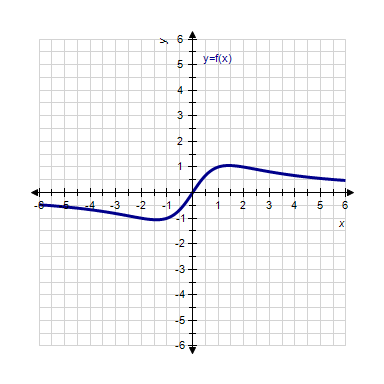
Answer: E
You might also like to view...
Solve the problem.The population of a formerly endangered mouse is now on the rise. The population, N, over the last 8 years can be represented with the following graph: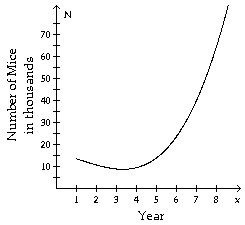 When was the mice population the lowest?
A. At the beginning of the 8 year period. B. Just before the end of the second year. C. During the fifth year. D. Just after the end of the third year.
Graph the function.f(x) = -4 ln x
A. 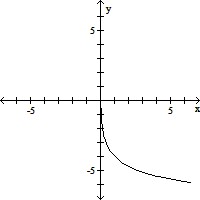
B. 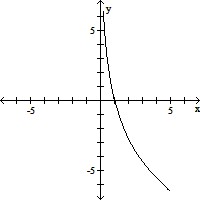
C. 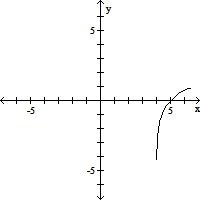
D. 
Solve.Elissa sells two breeds of dogs, Alaskan Malamutes and Great Pyrnees. She has 114 feet of fencing to enclose two adjacent rectangular dog kennels, one for each breed. An existing fence is to form one side of the kennels, as in the drawing below. Suppose the total length of the two kennels is x feet. Express the total area of the two kennels as a function of x. Graph the function and from the graph determine the value of x that will yield the maximum area.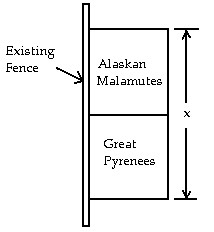
A. 59 feet
B. 56 feet
C. 57 feet
D.  feet
feet
y = cos (2t ) ? 2
For each of the following functions, find the amplitude, period, and midline. Also, find the maximum and minimum