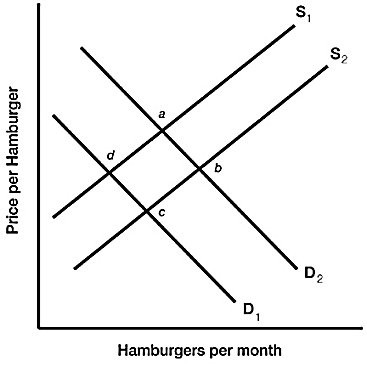
 Figure 3.6 illustrates a set of supply and demand curves for hamburgers. A decrease in supply and a decrease in quantity demanded are represented by a movement from:
A. point a to point d.
B. point c to point d.
C. point c to point a.
D. point b to point c.
Answer: B
You might also like to view...
Use the following graph showing the average total cost curve for a perfectly competitive firm to answer the next question.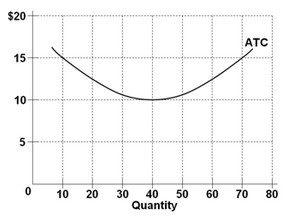 At the long-run equilibrium level of output, this firm's total revenue
A. is $400. B. is $10. C. is $40. D. cannot be determined from the information provided.
The Bretton Woods system was established in 1944 and remained in place until the early 1970s
Indicate whether the statement is true or false
What is the real exchange rate between the dollar and the euro equal to?
What will be an ideal response?
Firms in a monopolistically competitive market structure maximize their profit by producing an output where:
a. price equals average total cost. b. marginal cost equals average total cost. c. marginal cost equals price. d. marginal revenue equals marginal cost.