Diminishing marginal returns explains why a firm’s long-run average total cost curve is U shaped.
Answer the following statement true (T) or false (F)
False
You might also like to view...
Based on the figure below. Starting from long-run equilibrium at point C, an increase in government spending that increases aggregate demand from AD to AD1 will lead to a short-run equilibrium at point ________ creating _____gap. 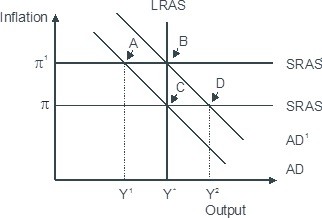
A. D; an expansionary B. B; no output C. B; expansionary D. A; a recessionary
In the above figure, an increase in income is best demonstrated by a
A) shift of D1 to D2 in Graph A, if good A is a normal good. B) shift of D2 to D1 in Graph A, if good A is a normal good. C) movement along D0 from P1 to P2 in Graph B. D) movement along D0 from P2 to P1 in Graph B.
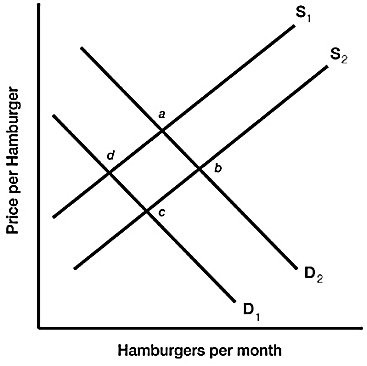
 Figure 3.6 illustrates a set of supply and demand curves for hamburgers. An increase in supply and a decrease in demand are represented by a movement from:
A. point d to point b. B. point d to point a. C. point a to point c. D. point b to point d.
In what type of analysis will an increase in the tax rate always lead to an increase in tax revenues?
A. dynamic tax analysis B. excise taxation C. static tax analysis D. ad valorem taxation