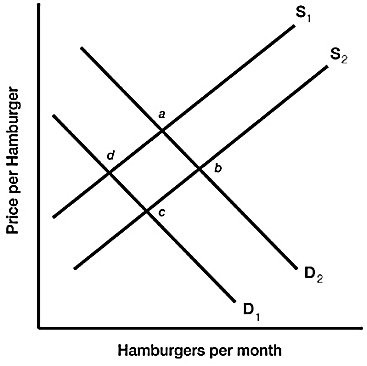
 Figure 3.6 illustrates a set of supply and demand curves for hamburgers. An increase in supply and a decrease in demand are represented by a movement from:
A. point d to point b.
B. point d to point a.
C. point a to point c.
D. point b to point d.
Answer: C
You might also like to view...
Explain why low-skilled workers find that their employment opportunities are less with a minimum wage
What will be an ideal response?
Which of the following is least accurate?
a. In 2007, the United States imports significantly more than it exports. b. Tariffs from imported goods accounted for over 90% of federal government revenue for the first 80 years of the United States. c. The largest trading partner of the colonial United States was England. d. In the late 1800s the US significantly increased its imports of raw materials to fuel its increased production of manufactured goods. e. During the Napoleonic War, the United States' exports decreased significantly because the war disrupted trade routes.
Which item is included in M1?
A. Large-denomination certificates of deposit B. Money market deposit accounts C. Passbook savings account balances D. Travelers checks
Using Figure 1 above, if the aggregate demand curve shifts from AD1 to AD2 the result in the long run would be: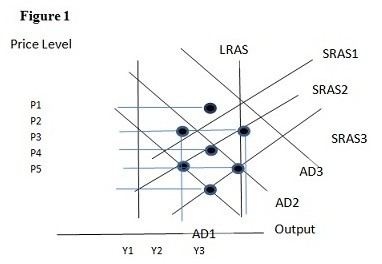
A. P1 and Y2. B. P2 and Y2. C. P3 and Y1. D. P2 and Y3.