Refer to the information provided in Table 23.2 below to answer the question(s) that follow.
Table 23.2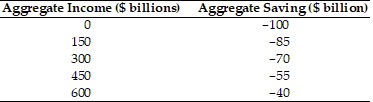 Refer to Table 23.2. Assuming society's MPC is constant, at an aggregate income of $1,200 aggregate saving would be
A. $0.
B. $20.
C. $55.
D. $150.
Answer: B
You might also like to view...
Your drink budget is entirely split between bottled water and fancy liqueurs, and your tastes are quasilinear in bottled water. In an attempt to get people to drink more water, the government introduces a subsidy that lowers the price of bottled water.
a. In a graph with bottled water on the horizontal and fancy liqueurs on the vertical axis, illustrate your before-subsidy budget and your optimal bundle A. b. As a result of the water subsidy, I notice you consume more fancy liqueur. Illustrate this in your graph using income and substitution effects. c. You and I are good friends, in part because I confided in you some time ago that I, too, have tastes that are quasilinear in water. (Nothing bonds like quasilinearity!) But, after the subsidy is introduced, you observe that I, unlike you, have reduced my consumption of fancy liqueurs. Your other friends claim that this is proof that our friendship is based on a fiction --- that I cannot possibly also have quasilinear tastes. Illustrate in a graph why your friends are wrong. d. If we both have quasilinear tastes, can you explain what the fundamental difference in our tastes is that accounts for the difference in behavior? What will be an ideal response?
In an open market purchase, the Fed ________ government securities, which ________ bank reserves
A) buys, increases B) buys, decreases C) sells, increases D) sells, decreases
Which of the following reduced the demand stimulus effects of the Fed's low interest rate policy pursued during, and after, the financial crisis of 2008-2009?
a. Declining stock prices during 2010-2012. b. An increase in the velocity of money. c. A reduction in earnings derived from money market accounts, saving deposits, and similar saving instruments. d. A sharp increase in the rate of inflation during 2009-2012.
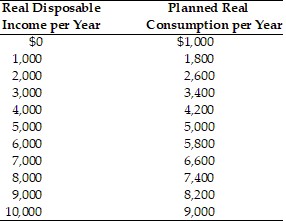 In the above table, the level of autonomous consumption is
A. $0. B. $5,000. C. $1,000. D. $9,000.