Refer to the information provided in Figure 26.2 below to answer the question(s) that follow.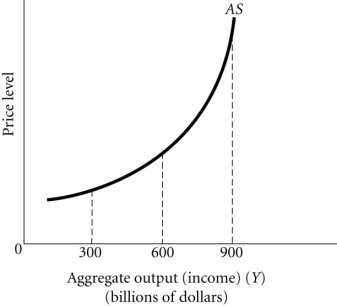 Figure 26.2Refer to Figure 26.2. Between the output levels of $600 billion and $900 billion, the relationship between the price level and output is
A. positive.
B. constant.
C. negative.
D. There is no relationship between the price level and output.
Answer: A
You might also like to view...
Assume an electric company has spent $3 billion on a nuclear power plant. It's producing at a price per kilowatt hour that is above its average variable cost. However, after 10 years the price remains below average total cost
If there is no expectation that price will equal or rise above the average total cost what would you expect this company to do with its nuclear power plant? Why is the $3 billion not part of the decision? Explain.
According to academic research, securities prices reflect new information
A) within a few minutes. B) within a day. C) within a week. D) within a month.
A causal effect for a single individual
A) can be deduced from the average treatment effect. B) cannot be measured. C) depends on observable variables only. D) is observable since it is used as part of calculating the mean of individual causal effects.
In the long-run the firm gets to choose which short-run curve it wants to use
a. True b. False Indicate whether the statement is true or false