Graph. -
-  = 1
= 1
A. 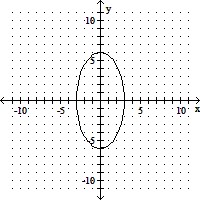
B. 
C. 
D. 
Answer: C
You might also like to view...
Simplify the complex fraction.
A. -2
B. 
C. - 
D. 2
Solve the equation.log (2 + x) - log (x - 5) = log 2
A. 
B. {-12}
C. {12}
D. ?
In 1950 the number of retirees was approximately 150 per thousand people aged 20-64. In 1990 this number rose to approximately 200, and it is projected to rise to 275 in 2020. Model N as a piecewise linear function of the time t in years since 1950, and use your model to project the number of retires per thousand people aged 20-64 in 1998. (Round you answer to the nearest integer.) ?
A. 220 people per thousand B. 154 people per thousand C. 198 people per thousand D. 264 people per thousand E. 286 people per thousand
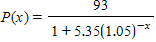
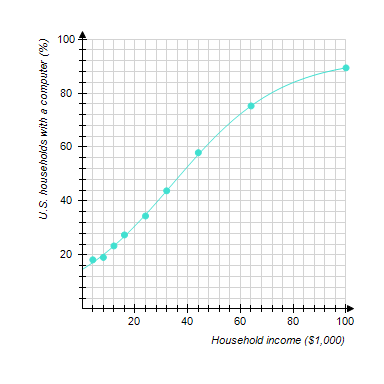
The following graph shows the actual percentage of U.S. households with a computer as a function of household income (the data points) and a logistic model of these data (the curve). The logistic model is
?
?
where x is the household income in thousands of dollars. For low incomes, the logistic model is approximately exponential. Which exponential model best approximates P(x) for small x? Round the coefficients to the nearest hundredth.
?
?
A. 
B. ?
C. ?
D. ?
E. ?