The lists below show five agricultural crops in Alabama, Arkansas, and Louisiana.AlabamaArkansasLouisianasoybeans (s)soybeans (s)soybeans (s) peanuts (p)rice (r)sugarcane (n)corn (c)cotton (t)rice (r)hay (h)hay (h)corn (c)wheat (w)wheat (w)cotton (t)Let U be the smallest possible set that includes all of the crops listed; and let A, K, and L be the sets of five crops in Alabama, Arkansas, and Louisiana, respectively. Find the indicated set.A' ? L
A. {h, p, w}
B. {h, n, p, r, t, w}
C. {n, r, t}
D. {c, n, r, s, t}
Answer: D
You might also like to view...
In a statistics class, 12 students have brown color eyes, 4 have blue eyes, 8 have hazel, and 2 green. What is the mode for this set of data?
A. 6.5 B. brown C. 12 D. none
Give an appropriate answer.The following table shows the average cost of a gallon of tea for the years 2008 through 2012.  Draw a line graph that makes the increase in the price look large.
What will be an ideal response?
Graph the ellipse and locate the foci. +
+  = 1
= 1 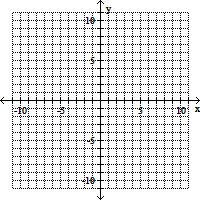
A. foci at (2 , 0) and (-2
 , 0)
, 0)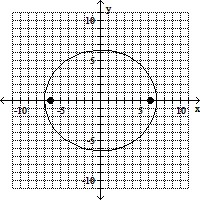
B. foci at (3, 0) and (-3, 0)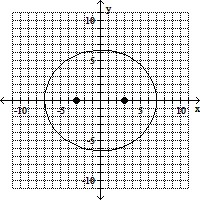
C. foci at (0, 7) and (0, -7)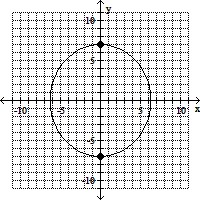
D. foci at (0, 3) and (0, -3)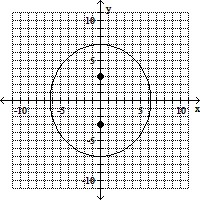
Complete numerical representations for the functions f and g are given. Evaluate the expression, if possible.(g?f)(1)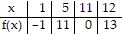
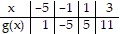
A. 11 B. -1 C. -5 D. 5