Which of these statistics best describes the relationship in this scatterplot?
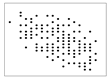
a. r = .00
b. r = .40
c. r = –1.00
d. r = –.50
d. r = –.50
You might also like to view...
You have ELLs in your class. Which of the following should you avoid?
a. Asking questions that require long sentences in response. b. Asking questions with yes/no responses. c. Asking for “tell your neighbor” responses. d. None of the above.
To be most effective a teacher must believe that all children can learn
Indicate whether the statement is true or false.
Applying Tinker, must school officials wait until a disruption occurs before acting?
a. No. School officials are permitted to act under any circumstances to curtail speech that is considered offensive. b. No. Several federal courts have held that school officials need not wait until a disruption occurs as long as there is a legitimate threat of a disruption. c. Yes. The U.S. Supreme Court has held that school officials must wait for a substantial disruption to occur before they act. d. Yes. The U.S. Department of Education issued a federal regulation that school officials must wait for a substantial disruption to occur before they act. e. None of the above.
Larry got whacked on the head and lost his vision, even though his eyes were unharmed. Where did Larry probably get whacked on the head?
A.right above his left ear B. right above the right ear C. in the nose D. the back of his skull