Refer to the information provided in Figure 7.1 below to answer the following question(s). 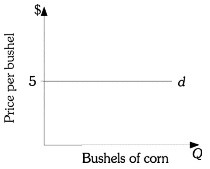 Figure 7.1Refer to Figure 7.1. This corn producer produces 100 bushels of corn and sells each bushel at $5. The cost of producing each bushel is $2. This corn producer's total revenue is ________ and profit is ________.
A. $200; $300
B. $300; $200
C. $500; $200
D. $500; $300
Answer: D
You might also like to view...
Refer to the figure above. What is the social surplus if the market is in equilibrium?
A) $50 B) $75 C) $100 D) $150
Refer to the above figures. Which panel(s) represent the effect of a decrease in labor productivity?
A) Panel A only B) Panels A and C only C) Panel D only D) Panels B and D only
In the short-run macro model, what is the relationship between income and government purchases?
a. It is positive and stable. b. It is positive but unstable. c. It is negative and stable. d. It is negative but unstable. e. There is no relationship between the two variables.
As the interest rate increases, the velocity of money will increase as well
a. True b. False Indicate whether the statement is true or false