Figure 4-9
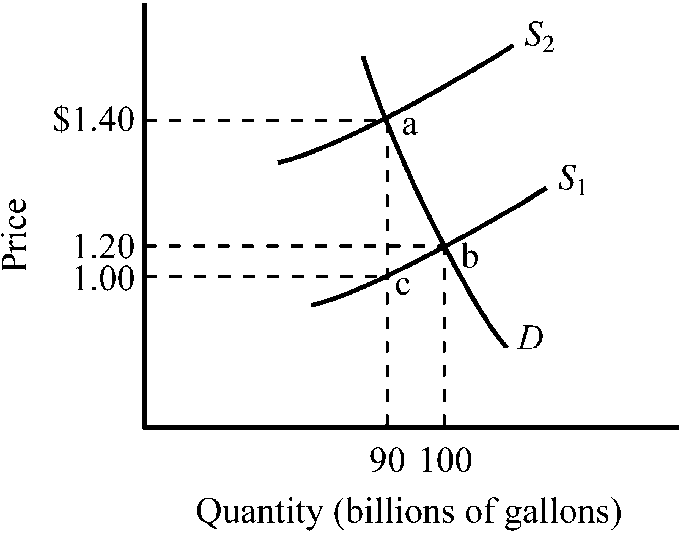
Refer to . The market for gasoline was initially in equilibrium at point b and a $.40 excise tax is illustrated. What does the triangular area abc represent?
a.
the revenue the government derives from the tax
b.
the tax paid by consumers
c.
the tax paid by producers
d.
the deadweight loss (or excess burden) created by the tax
d
You might also like to view...
Which of the following statements correctly defines the law of demand?
a. The lower the price of a commodity, the lower the quantity demanded of that commodity. b. As the price of a commodity increases, the quantity demanded of that commodity also increases. c. The lower the price of a commodity, the greater the quantity demanded of that commodity. d. The lower the price of a commodity, the greater the quantity supplied of that commodity. e. The quantity demanded of a particular good decreases with an increase in the price of a substitute good.
Discuss the concept in econometrics that states, "garbage in . . . garbage out."
What will be an ideal response?
The figure below represents the effects in the labor markets due to migration. Here, the world has been divided into a high-income "North" (left panel) and a low-income "South" (right panel). Dn and Sn are the labor demand and the labor supply curves in North. Ds and (Sr + Smig) are the labor demand and pre-migration labor supply curves in South. Sr is the post-migration labor supply curve in South. The value c is the cost of migrating.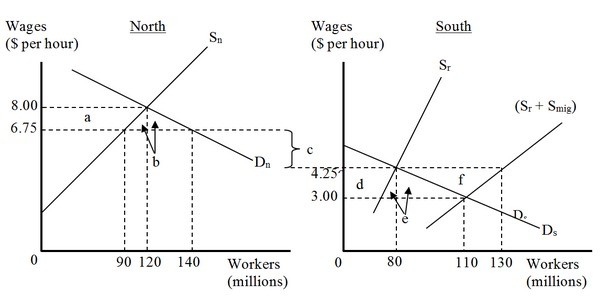 The net gain to the migrants is represented by the area
A. (a + f). B. (e + f). C. (d + e). D. (a + b).
Market failures include all of the following EXCEPT
A. buyers pay for all the costs involved in the production of goods and services. B. negative externalities. C. positive externalities. D. public goods.