Figure 4.5 illustrates a set of supply and demand curves for hamburgers. An increase in demand and an increase in quantity supplied are represented by a movement from
A) point b to point d. B) point d to point a. C) point c to point d. D) point b to point a.
B
You might also like to view...
Use the figure below to answer the following question.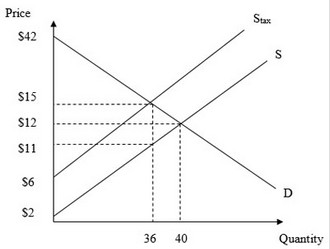 What is the amount of producer surplus after the government imposes the excise tax on the market?
A. $162 B. $540 C. $486 D. $180
If ranchers in Texas fear a sharp drop in cattle prices next year, they will probably
A) bring less cattle to market this year. B) bring more cattle to market this year. C) keep supply unchanged now and bring more cattle to market next year. D) keep supply unchanged now and bring less cattle to market next year. E) do none of the above.
The production function shifts upward as the capital stock increases
a. True b. False Indicate whether the statement is true or false
For a profit-maximizing monopolistically competitive firm, marginal revenue equals marginal cost in
a. the short run but not in the long run. b. the long run but not in the short run. c. both the short run and the long run. d. neither the short run nor the long run.