Figure 10-7
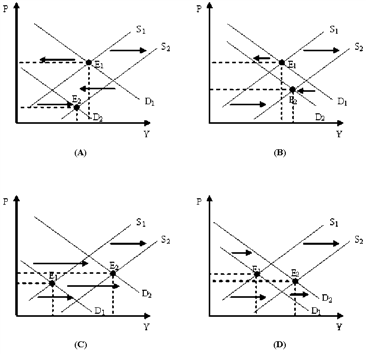
Refer to Figure 10-7. Which of the diagrams in Figure 10-7 represents a decrease in consumer spending combined with a positive supply shock?
a.
Panels (A) & (B)
b.
Panels (C) & (D)
c.
Panels (A) & (C)
d.
Panels (B) & (D)
a
You might also like to view...
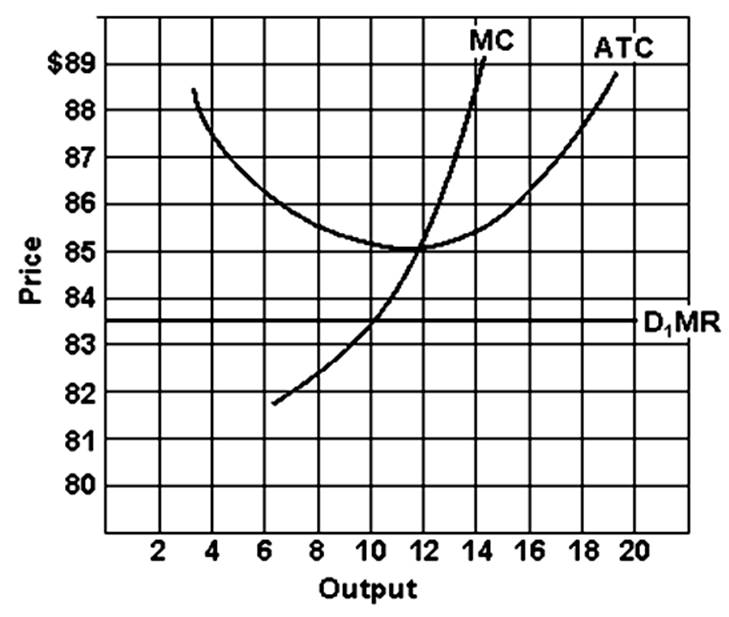
How much is the firm's ATC?
The purchasing power of money increases when
A. the inflation rate increases. B. there is deflation. C. there are more dollars in the economy. D. there is inflation.
A family that earns $20,000 a year pays $4,000 a year in payroll taxes. A family that earns $40,000 a year pays $8,000 a year in payroll taxes. The payroll tax is a ________ tax.
A. progressive B. regressive C. proportional D. benefits-received
Evaluate the statement: “No nation can grow without a large natural resource base.”
What will be an ideal response?