Solve the problem.This chart shows the number of meals served in a restaurant during each of the past 4 months. Assume that the information in the chart defines a function with the name g. State the domain of g.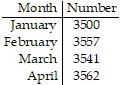
A. {3500, 3557, 3541, 3562}
B. {(3500, January), (3557, February), (3541, March), (3562, April)}
C. {January, February, March, April}
D. {(January, 3500), (February, 3557), (March, 3541), (April, 3562)}
Answer: C
You might also like to view...
Find the exact value of the expression.cos 40° cos 20° - sin 40° sin 20°
A. 
B. 
C. 
D. 
Predict the number of tick marks on the positive x - axis and the positive y-axis.[-600, 600, 10] by [-900, 900, 10]
A. 90; 60 B. 60; 90 C. 600; 900 D. 900; 600
Match the function to the correct graph.y = x3 - 3x + 2
A. 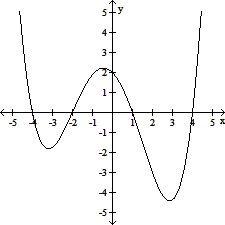
B. 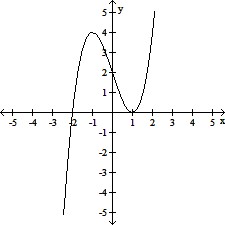
C. 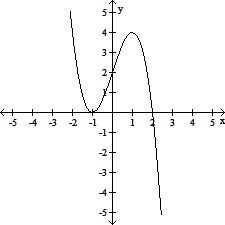
D. 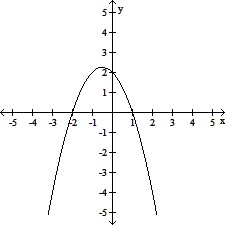
Answer the problem.Use the following function and a graphing calculator to answer the questions.f(x) =  + 0.8 sin x, [0, 2?]a). Plot the function over the interval to see its general behavior there. Sketch the graph below.
 b). Find the interior points where f' = 0 (you may need to use the numerical equation solver to approximate a solution). You may wish to plot f' as well. List the points as ordered pairs (x, y).c). Find the interior points where f' does not exist. List the points as ordered pairs (x, y).d). Evaluate the function at the
endpoints and list these points as ordered pairs (x, y).e). Find the function's absolute extreme values on the interval and identify where they occur. What will be an ideal response?