Use the horizontal line test to determine whether the function is one-to-one.
A. Yes
B. No
Answer: B
You might also like to view...
Find the exact value of the expression.tan
A. - 
B. 
C. - 
D. - 
Use a fraction to represent the shaded area of the figure.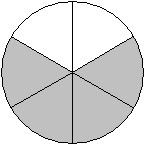
A. 
B. 
C. 
D. 
 .
?
What must be filled in the blank to make the statement true?
?
.
?
What must be filled in the blank to make the statement true?
?
A. 
B. 
C. 
D. 
Solve the problem. The following table shows the number of adults in a certain city who approve of the mayor's performance in various years. It also gives the total number of adults in the city in the same years. 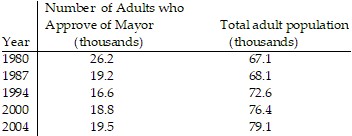 Let p be the percentage of adults in the city who approve of the mayor's performance in the year that is t years since 1980. A reasonable model of the situation is: p =
  Use this model to estimate the percentage of adults in the city who approved of the mayor's performance in 1994. What is the actual percentage who approved of the mayor's performance in 1994? Is
your estimate using the model an overestimate or an underestimate? Predict the percentage of adults in the city who will approve of the mayor's performance in 2010. What will be an ideal response?