Refer to the table to answer the question. 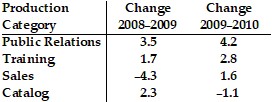 Which category and year represents the least change?
A. Catalog, 2008-2009
B. Catalog 2009-2010
C. Training 2008-2009
D. Sales, 2009-2010
Answer: B
You might also like to view...
Write the inequality using interval notation. Graph the inequality.-3 ? x < 1![]()
A. [-3, 1]![]()
B. (-3, 1)![]()
C. (-3, 1]![]()
D. [-3, 1)![]()
Graph the function, and state its domain and range.f(x) = -3x3
A. Domain: (-?, ?); Range: (-?, ?)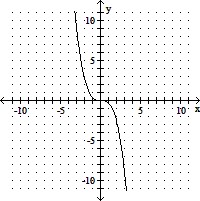
B. Domain: (-?, ?); Range: (-?, ?)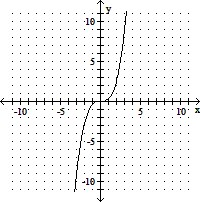
C. Domain: (-?, ?); Range: (-?, ?)
D. Domain: (-?, ?); Range: (-?, ?)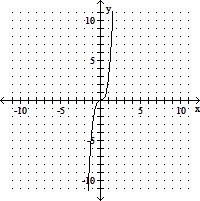
Analyze the graph of the given function f as follows:(a) Determine the end behavior: find the power function that the graph of f resembles for large values of |x|.(b) Find the x- and y-intercepts of the graph.(c) Determine whether the graph crosses or touches the x-axis at each x-intercept.(d) Graph f using a graphing utility.(e) Use the graph to determine the local maxima and local minima, if any exist. Round turning points to two decimal places.(f) Use the information obtained in (a) - (e) to draw a complete graph of f by hand. Label all intercepts and turning points.(g) Find the domain of f. Use the graph to find the range of f.(h) Use the graph to determine where f is increasing and where f is decreasing.f(x) = x2(x + 2)
What will be an ideal response?
Simplify. Write your answer in the form a + bi, where a and b are real numbers.(6 - 6i) + (1 - 3i)
A. 7 + 9i B. -7 - 9i C. 7 - 9i D. 7 - 3i