Refer to the graph shown depicting a monopolistically competitive firm. The demand curve is represented by curve: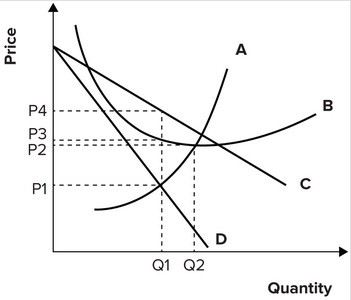
A. A.
B. B.
C. C.
D. D.
Answer: C
You might also like to view...
Assume that yields on bonds (rate of return) begin to fall while the stock market is booming, what should we see happen to the demand and price of stocks and why?
What can we say about the opportunity cost of holding on to bonds in this situation?
A trade surplus exists if export spending is less than import spending
Indicate whether the statement is true or false
If output decreases, which of the following would occur?
a. Prices of non-labor inputs, input requirements per unit of output and unit costs would all increase and the economy would move upward along the aggregate supply curve. b. Prices of non-labor inputs, input requirements per unit of output and unit costs would all decrease and the economy would move upward along the aggregate supply curve. c. Prices of non-labor inputs, input requirements per unit of output and unit costs would all increase and the economy would move downward along the aggregate supply curve. d. Prices of non-labor inputs, input requirements per unit of output and unit costs would all decrease and the economy would move downward along the aggregate supply curve. e. Prices of non-labor inputs would decrease, input requirements per unit of output would increase and the economy would move upward along the aggregate supply curve.
The backward-bending supply curve for labor shows how an increase in wages affects the number of hours worked. The “backward bend” is the part of the curve that shows that some people:
a. have no flexibility in the number of hours they work. b. work more hours when income rises. c. work more hours when income falls. d. work fewer hours when income rises.