How does this graph show that ES ? 1?
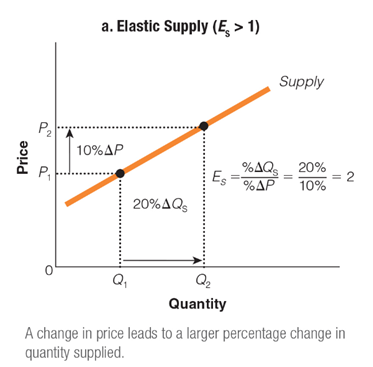
a. P1 to Q2 is greater than P2 to Q1
b. P1 to Q2 is less than P2 to Q1
c. Q1 to Q2 is greater than P1 to P2
d. Q1 to Q2 is less than P1 to P2
c. Q1 to Q2 is greater than P1 to P2
You might also like to view...
People expect that the El Niño effect will cause drought in Australia in coming years. If most Australian firms expect their profits will fall during the next five years, Australia's ________ this year
A) aggregate demand will increase B) long-run aggregate supply will increase C) aggregate demand will decrease D) short-run aggregate supply will increase
In the above figure, the competitive unregulated equilibrium is producing and consuming ________ vaccinations per year at a price of ________
A) 30 thousand; $40 B) 30 thousand; $30 C) 30 thousand; $20 D) 50 thousand; $30
Under a floating exchange rate, the exchange rate
A) is determined by the interaction of supply of the currency and demand for the currency. B) is controlled by central bank intervention. C) is pegged against the euro. D) will change whenever the price of gold changes.
Using aggregate demand and aggregate supply, explain what happens in the short run if the Federal Reserve raises interest rates in the economy. Be sure to detail what happens to aggregate demand, the price level, the level of GDP, and unemployment
Assume that the economy is at full employment before the interest rate increase.