A marginal benefit curve shows
A) the efficient use of resources.
B) the quantity of one good that must be forgone to get more of another good.
C) the quantity of one good that people are willing to forgo to get another unit of another good.
D) there are increasing opportunity costs.
C
You might also like to view...
Use the following diagrams for the U.S. economy to answer the next question.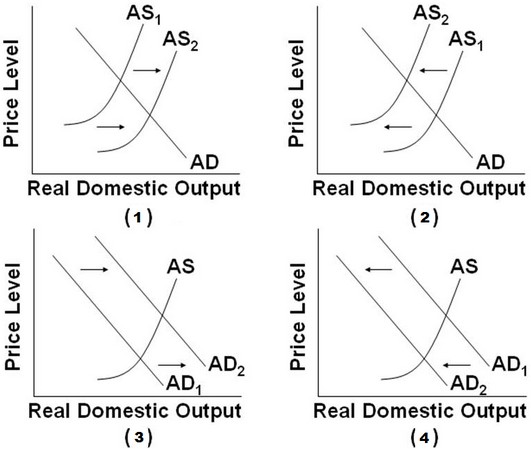 Which of the diagrams best portrays an expansion?
A. Graphs (1) and (2) B. Graphs (1) and (3) C. Graphs (2) and (4) D. Graphs (3) and (4)
Using the aggregate expenditure model, the equilibrium level of the aggregate expenditure can occur when the economy is producing
A) only at above full employment. B) at full employment, above full employment, or below full employment. C) at either below full employment or at full employment but never at above full employment. D) only at below full employment. E) only at full employment.
Refer to Table 9-11. Prior to trade, what was the opportunity cost to produce 1 clock in Belize?
A) 1/2 of a hat B) 2/3 of a hat C) 1.5 hats D) 2 hats
When the United States engaged in quantitative easing from 2008 to 2014, why didn't the money supply rise sharply?
A) Foreigners wanted all the new dollars created by the Federal Reserve. B) Banks held the increased monetary base as excess reserves. C) The Fed offset the increased monetary base by raising reserve requirements. D) The Fed offset the increased monetary base by buying foreign currency.