Using Table 6.1, the inflation rate for 2002 would be 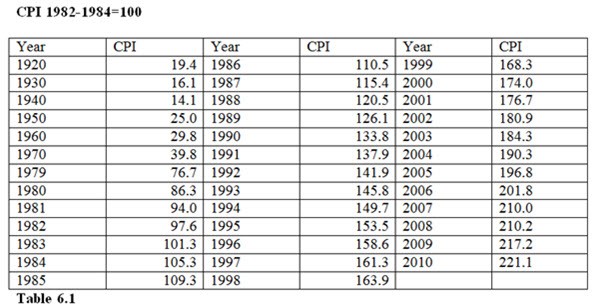
A. 80.9% (180.9-100).
B. 2.4% (((180.9-176.7)/176.7)*100 %).
C. 2.2% (184.3-176.7)/(2*176.7)*100%).
D. 4.2% (180.9-176.7).
Answer: B
You might also like to view...
Exhibit 30-3 Costs of Eliminating:Firm A Firm B Firm C 1st ton of pollution$ 30 $ 50 $ 600 2nd ton of pollution$ 70 $ 90 $ 700 3rd ton of pollution$125 $150 $ 900 4th ton of pollution$200 $250 $1,300 Refer to Exhibit 30-3. What is the cost to Firm B of eliminating 2 tons of pollution?
A. $350 B. $250 C. $300 D. $140 E. $540
In the Keynesian cross diagram, an increase in autonomous consumer expenditure causes the aggregate demand function to shift up, the equilibrium level of aggregate output to ________, and the IS curve to shift to the ________,
everything else held constant. A) rise; left B) rise; right C) fall; left D) fall; right
Which is true?
A. Production functions consider only the value added part of a particular production process. B. Production functions count raw materials, but not labor, as inputs into the production process. C. Production functions do not count technology into the production process. D. Production functions are as subjective as utility functions.
When one strategy is always the best for a player to choose, regardless of what other players do, it is called:
A. collusion. B. the prisoner's dilemma. C. a Nash equilibrium. D. a dominant strategy.