Variables X and Y in the table below are:
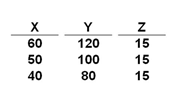
A. Positively related
B. Negatively related
C. Not directly related
D. Independently related
Answer: A
You might also like to view...
On the graph above, the wage level at point ________ might represent an efficiency wage
A) 2 B) 4 C) 6 D) 5
In the following situation, the tax system is Taxable income $1,000 $2,000 $4,000 $8,000 Tax payments $10 $30 $90 $270
a. progressive throughout all levels of income b. progressive between $1,000 and $2,000 of income but regressive above $2,000 c. regressive throughout all levels of income d. regressive between $1,000 and $2,000 of income but progressive above $2,000 e. proportional throughout all levels of income
If you observed the wage rate decreasing while employment increased, which of the following would be a possible explanation?
a. A decrease in labor demand b. A decrease in labor demand coupled with a decrease in labor supply c. An increase in labor supply d. A decrease in labor supply e. It is not possible for the wage rate to decrease while employment is increasing
Edgar Browning and William Johnson, in a paper published in the Journal of Political Economy (1984), presented evidence that a one-dollar transfer to the bottom 40 percent of income distribution costs the top 60 percent nine dollars. If correct, this finding proves
A. the tax system is generating significant excess burdens. B. these transfers are not worth the cost. C. loopholes have to be closed. D. the burden of the tax system is too great.