Make a line graph of the data in the table.The following table gives the average cost of producing a music video over the given years. Use time on the horizontal scale for your line graph.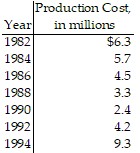
What will be an ideal response?
Answers may vary. A possible answer follows.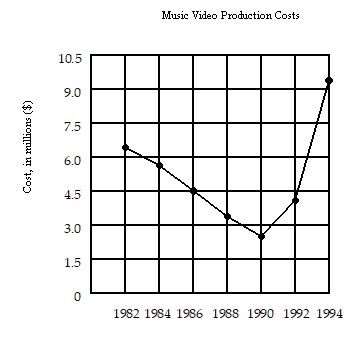
Mathematics
You might also like to view...
Determine the order of the matrix.
A. 6 × 6 B. 9 C. 2 × 3 D. 3 × 3
Mathematics
The line graph shows the recorded hourly temperatures in degrees Fahrenheit at an airport. Use the graph to answer the question.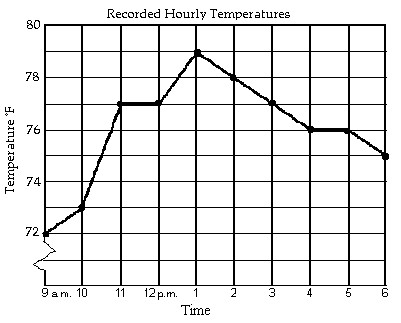 At what time was the temperature the lowest?
A. 10 a.m. B. 1 p.m. C. 9 a.m. D. 6 p.m.
Mathematics
Combine like terms.16.7x - 3.5 - 9.9x + 13
A. 7.8x + 9.5 B. 6.8x + 10.5 C. 6.8x + 9.5 D. 16.3x
Mathematics
Answer the question.True or False: The graph of the equation x + 5y = 0 goes through the origin.
A. True B. False
Mathematics