Draw a scatter diagram of the inflation rate and the interest rate. Describe the relationship
What will be an ideal response?
To make a scatter diagram of the inflation rate and the interest rate, plot the inflation rate on the x-axis and the interest rate on the y-axis. The graph will be a set of dots and is shown in Figure A1.4 . The pattern made by the dots tells us that as the inflation rate increases, the interest rate usually increases so there is a (weak) positive relationship.
You might also like to view...
According to the above table, if per capita real GDP is currently $1000, then at a constant annual rate of growth of 8 percent, per capita real GDP ten years from now will be equal to
A) $2140. B) $2160. C) $2000. D) $2590.
Government spending on a transfer payment is illustrated by
a. interstate highways b. elementary and high school education c. community colleges d. land-grant universities e. agricultural subsidies
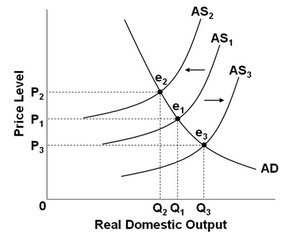 Refer to the above diagram. If aggregate supply shifts from AS1 to AS2, then the price level will:
A. increase and real domestic output will decrease. B. decrease and real domestic output will decrease. C. decrease and real domestic output will increase. D. increase and real domestic output will increase.
Recall the Application about property rights, urban slums, and the role of government in a market economy to answer the following question(s).According to the Application, what percentage of the world's population currently lives in urban squatter settlements and therefore has very little housing security?
A. 1% B. 10% C. 30% D. 50%