Figure 19-2
?

Of the graphs in Figure 19-2, which one shows Japan practicing “dirty” floating to keep an undervalued currency?
A. 1
B. 2
C. 3
D. 4
Answer: C
You might also like to view...
Following the lifting of price controls that had been implemented in the early 1970s, inflation skyrocketed. Economists' explanations for this acceleration in the price level include:
a. the increase in the money supply that also occurred during the early 1970s. b. increases in the federal government deficit, especially in 1971 and 1972. c. supply-side shocks in oil and food. d. the release of inflationary pressures that built up during the period of price controls. e. All of the above.
Producer surplus measures the value between the actual selling price and the:
a. price sellers are willing to sell the product. b. deadweight loss price. c. lowest price sellers are willing to sell the product. d. profit-maximization price.
Your bike is worth $100 and if you park it outside at school there is a 25% chance that it will be stolen. Your utility function for money is U = (M)2. Assume throughout that the bike value and money are interchangeable since you could sell the bike instantly at its value if necessary. Campus security has a bike check in that will guard your bike for $15 so there will be no risk of loss. Do you take the campus security deal?
What will be an ideal response?
Figure 5-1
?
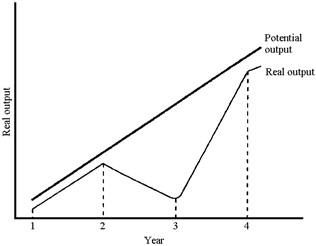 Figure 5-1 plots potential and real output for a hypothetical economy. Based on this graph, the recession occurred
A. between years 1 and 2. B. between years 2 and 3. C. between years 3 and 4. D. after year 4.