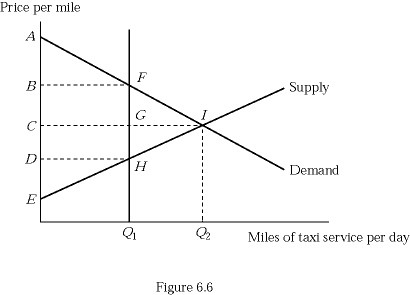
 Refer to Figure 6.6, which shows a market for taxi medallions. If the number of taxi licenses is reduced from Q2 to Q1, the consumer surplus:
A. decreases by area FGI.
B. decreases by (area BCFG + area FGI).
C. decreases by area GHI.
D. decreases by (area CDGH + area GHI).
Answer: B
You might also like to view...
With everything else the same, which of the following would increase the demand for U.S. dollars in the foreign exchange market?
I. a rise in the U.S. interest rate II. a fall in interest rates in foreign countries III. a rise in the expected future exchange rate A) I only B) I and II only C) I and III only D) I, II, and III
In the U.S., time use data is collected on a national level by the:
a. Consumer Product Safety Commission b. Federal Reserve Board c. Dept. of Health and Human Services d. Bureau of Labor Statistics (BLS)
Which of the following would most likely increase the demand for televisions?
a. A decrease in the price of televisions. b. A decline in consumer income. c. A decrease in the price of home stereo systems, a substitute for televisions. d. A decrease in the price of DVD players, a product that is complementary with televisions.
Figure 10-7
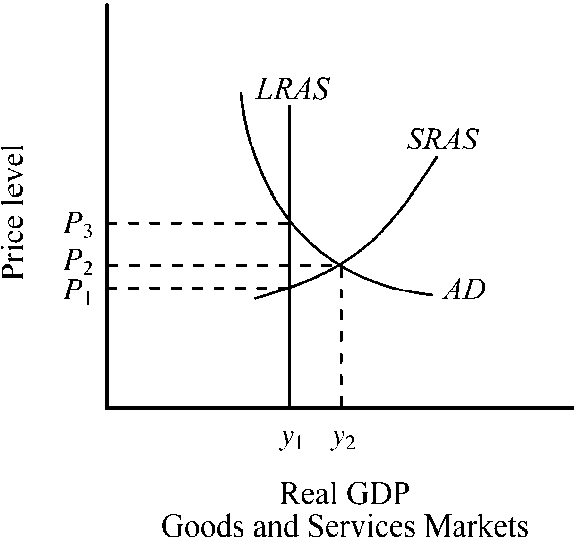
Given the aggregate demand and aggregate supply curves for the economy depicted in , the economy's output and price level are
a.
output y1 and price level P1.
b.
output y2 and price level P2
c.
output y1 and price level P3.
d.
output y2 and price level P1.