Consider the clustered bar chart of the dashboard developed to monitor the performance of a call center:
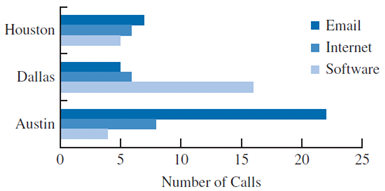 This chart allows the IT manager to
A. identify how often a problem is related to hardware.
B. identify the frequency of a particular type of problem by location.
C. identify which city contains the most customers.
D. identify the percent of customers who do not have one of the listed problems.
Answer: B
You might also like to view...
A/An _______________ is a neutral third party who is informally assigned to persuade opponents to communicate.
a. Mediator b. Arbitrator c. Intermediary d. Conciliator
Factors that a designer can control include ______.
a. random factors b. signal factors c. noise factors d. ISO factors
Each host device's ________ reveals two things: the network address the host is on and the address of the host itself within the network
A) IP Router B) IP Address C) IP Network D) IP Subnet
Dynamic modeling portrays actions and interactions of a system's components to satisfy its behavioral requirements
Indicate whether the statement is true or false