Refer to the information provided in Figure 5.7 below to answer the question(s) that follow.
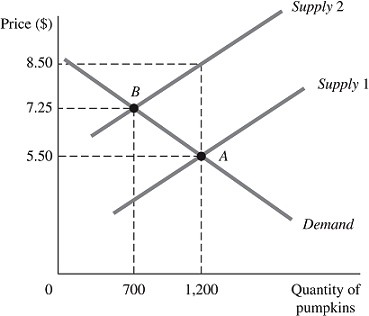 Figure 5.7The above figure represents the market for pumpkins both before and after the imposition of an excise tax, which is represented by the shift of the supply curve.Refer to Figure 5.7. Had the demand for pumpkins been perfectly inelastic at Point A, the amount customers would have paid per pumpkin after the imposition of this tax would have been
A. $0.
B. $5.50.
C. $7.25.
D. $8.50.
Answer: D
You might also like to view...
Discretionary fiscal policy is defined as fiscal policy
A) left to the discretion of military authorities. B) initiated by an act of Congress. C) initiated by a Presidential proclamation. D) triggered by the state of the economy. E) with multiplier effects.
In the countries that have adopted inflation targeting, the inflation rate has typically
A) not changed. B) decreased to zero. C) increased. D) decreased.
Many countries in sub-Saharan Africa have very low labor productivities in many sectors, for example in manufacturing and agriculture
They often despair of even trying to attempt to build their industries unless it is done in an autarkic context, behind protectionist walls because they do not believe they can compete with more productive industries abroad. Discuss this issue in the context of the Ricardian model of comparative advantage.
Holding supply constant, a reduction in demand leads to
A) lower prices and higher quantity supplied. B) lower prices and lower quantity supplied. C) higher prices and higher quantity supplied. D) higher prices and lower quantity supplied.