Use the data shown in the scatter plot to determine whether the data should be modeled by a linear function.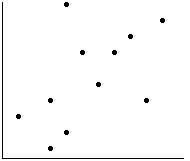
A. No, data points do not lie close to a line
B. Yes, approximately linear
C. Yes, exactly linear
Answer: A
You might also like to view...
The graph below shows the approximate annual percentage growth rate in world population for the years 1960 through 2010. Data is estimated by the UN Census Bureau.Annual Growth Rate (Percentage)  Use the graph to answer the question.In which year during the period 1960-2010 is estimated world population the greatest?
A. 1970 B. 1963 C. 1960 D. 2010
Provide an appropriate response.Divide the radicals and simplify: 
A. 12
B. 7
C. 5
D. 14
Determine whether the given number is a zero of the polynomial function.P(x) = -x4 - 9x2 - x + 8; 1
A. No B. Yes
Given the polynomial function f(x), find the rational zeros, then the other zeros (that is, solve the equation  ), and factor f(x) into linear factors.f(x) = x3 - 9x2 + 13x + 7
A. 7, 1 +  , 1 -
, 1 -  ; f(x) = (x - 7)(x + 1 -
  )(x + 1 +
  )
)
B. 7, -1 +  , -1 -
  ; f(x) = (x - 7)(x + 1 -
  )(x + 1 +
  )
)
C. 7, 1 +  , 1 -
, 1 -  ; f(x) = (x - 7)(x - 1 -
  )(x - 1 +
  )
)
D. -7, 1 +  , 1 -
, 1 -  ; f(x) = (x + 7)(x - 1 -
  )(x - 1 +
  )
)