Refer to the diagram. All other things equal, curve C:
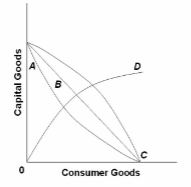
A. reflects increasing opportunity costs because the slope of the curve becomes less steep as
one moves down along the curve.
B. is a less desirable production possibilities curve for an economy than curve B.
C. is a more desirable production possibilities curve for an economy than curve A.
D. has a steeper slope throughout than curve B.
C. is a more desirable production possibilities curve for an economy than curve A.
You might also like to view...
What does a perfectly elastic demand curve look like? A perfectly inelastic demand curve? Explain
What will be an ideal response?
The graph shown demonstrates a tax on sellers. Who bears the greater tax incidence?
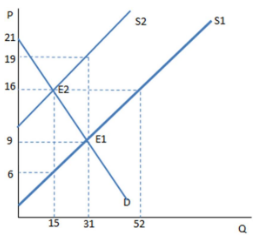
A. The sellers
B. The buyers
C. The government
D. The incidence is equally shared between buyer and seller.
What is the relationship between marginal utility and an individual demand curve?
What does an upward-sloping supply curve mean?
What will be an ideal response?