Graph the given function as a solid line (or curve) and its inverse as a dashed line (or curve) on the same set of axes.f(x) = x3 + 1
A. 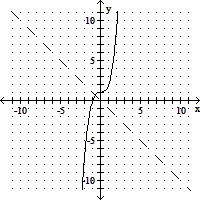
B. 
C. 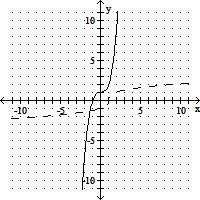
D. 
Answer: C
You might also like to view...
First, rewrite each equation in exponential form. Then, use a table of coordinates and the exponential form to graph the logarithmic function. Begin by selecting -2, -1, 0, 1 and 2 for y. Finally, based on your graph, describe the shape of a scatter plot that can be modeled by f(x) = log b x, 0 < b < 1.y = log1/7 x
A. 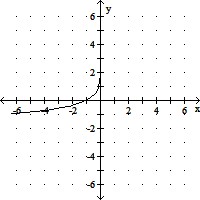
increasing
B. 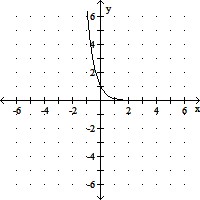
decreasing,
although rate of decrease is slowing down
C. 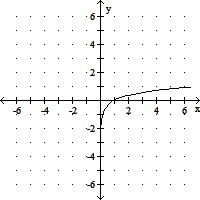
increasing,
although rate of increase is slowing down
D. 
decreasing,
although rate of decrease is slowing down
Solve the application.The diagram below shows the side view of a plan for a slanted roof. Find the unknown length in this roof plan. Give an exact answer, then approximate the length to the nearest tenth of a foot.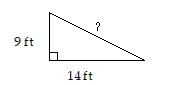
A.  ft ? 4.8 ft
B.  ft = 138.5 ft
C.  ft ? 16.6 ft
D.  ft ? 9.7 ft
Solve.Use the formula C =  (F - 32) to write 212° F as degrees Celsius.
A. 85.8° C B. 100° C C. 135.6° C D. 413.6° C
Write the shaded area in the figure as a mixed number and as an improper fraction.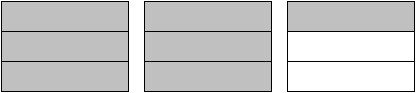
A. 2 ;
; 
B. 2 ;
; 
C. 2 ;
; 
D. 3 ;
; 