Refer to the figures below to answer the following question.
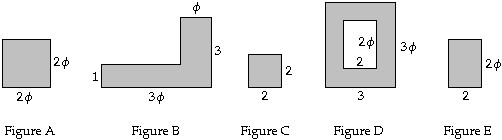 Which of the figures is a gnomon to Figure D?
A. Figure A
B. Figure E
C. Figure B
D. Figure C
E. none of these
Answer: E
You might also like to view...
Beginning in 2001 the price, in dollars per ounce, of gold was modeled approximately by
 ,
where t is the time in years since the beginning of 2001.A: Make a graph of G versus t that shows estimated gold prices for 2001 to 2010.B: A broker recommended purchase of gold as long as the price was between $400 and $700 per ounce. Add the horizontal lines
,
where t is the time in years since the beginning of 2001.A: Make a graph of G versus t that shows estimated gold prices for 2001 to 2010.B: A broker recommended purchase of gold as long as the price was between $400 and $700 per ounce. Add the horizontal lines  and
and  to your graph.C: During what time period was the purchase of gold advised? Give your answer in terms of t correct to two decimal places.
What will be an ideal response?
to your graph.C: During what time period was the purchase of gold advised? Give your answer in terms of t correct to two decimal places.
What will be an ideal response?
Solve the problem.The table below shows the population of a city in various years. Use the data to draw a graph of the population as a function of time. Use the graph to estimate when the population reached 6.4 million 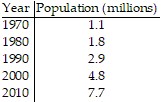
A. 2005 B. 2004 C. 2007 D. 2006
The function s gives the displacement (in ft) of an object as a function of time (in seconds). Calculate values of the average velocity for the given values of t and find the instantaneous velocity at the indicated value of t by noting the limit of the average velocities.s = 80t - 18t2 ; when t = 0.5; use values of t of 0.45, 0.49, 0.499, 0.4999
A. Average velocities: 22.9, 22.18, 22.018, 22.0018 v = 22 ft/s
B. Average velocities: 44.9, 44.18, 44.018, 44.0018 v = 44 ft/s
C. Average velocities: 62.9, 62.18, 62.018, 62.0018 v = 62 ft/s
D. Average velocities: 4.9, 4.18, 4.018, 4.0018 v = 4 ft/s
Use the fundamental identities to simplify the expression. + sec ? cos ?
A. sec2? B. csc2? C. tan2? D. 1