Using Figure 1 above, if the aggregate demand curve shifts from AD2 to AD3 the result in the long run would be: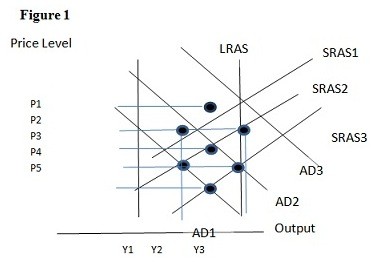
A. P2 and Y2.
B. P1 and Y2.
C. P4 and Y2.
D. P1 and Y1.
Answer: B
You might also like to view...
The graph shown demonstrates a tax on sellers. Which of the following can be said about the effect of this tax?
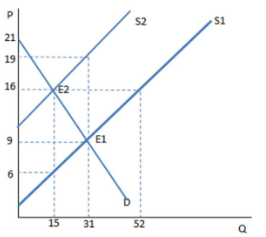
The graph shown demonstrates a tax on sellers. Which of the following can be said about the A. The tax creates a shortage, and rationing must occur.
B. The tax creates a surplus, and the government must buy the excess.
C. The tax creates a shortage, and the government must regulate the market.
D. None of these is true.
In economic theorizing, common sense will always lead to the correct answer
a. True b. False Indicate whether the statement is true or false
Which statement is false?
A. Most jobs in defense plants during World War II were held by white males. B. The federal government instituted wage and price controls during World War II. C. Very little new housing was built during the Great Depression and World War II. D. None of the statements are false.
Purchases of ________ are the most volatile type of expenditures because they are very sensitive to the interest rate, which is highly volatile.
A. new cars B. nondurables C. new houses D. stocks